|
DEATH CERTIFICATE PROJECT |
Authors of the project .: prof. Andrzej Brodziak and Damian Kaszuba
The short outline of the project
The object of the project: We aim to contact other researchers, especially from the countries of the southern hemisphere of the planet to verify some important and interesting hypotheses, related to the theory of diseases, the environmental influences on human organism and the philosophy of nature.
The methodology: The possible collaboration would be possible trough the computation of the mortality rates and some other factors on the basis of local epidemiological data and the comparison with our results obtained for Poland, it means a country placed between 50-55o of the geographical latitude.
The expected results: The comparison of data obtained in such countries as Australia, New Zealand, Chile, Argentina, South Africa, Malaysia, Singapore with our data would enable us to draw some conclusions related to the initial set of hypotheses and to publish them (jointly) in the international medical journals.
The workshops, meetings and conferences: When the international cooperation would be formed the participants of the project there could be organized the series of conferences and the authours could seek for grants for further research.
The planned way of cooperation: Any scientific centre interested in the aim of this project could present the epidemiological data in the form of a “internet page (file)”, which would be accessible for any other interested research group.
Apart of the formulation of the page presenting the local result a discussion group (“internet community” - using for instance “http://www.deja.com”) could be settled.
The normal e-mail exchange also expected.
The initial set of hypotheses:
The data computed by us it means in a country placed between 50-55o of the Northern and presented bellow, convince that:
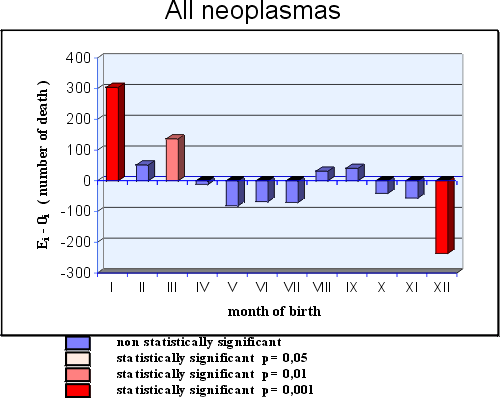
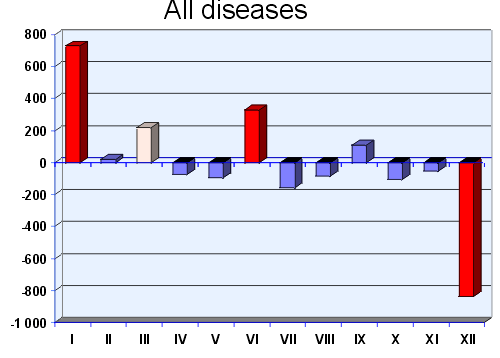
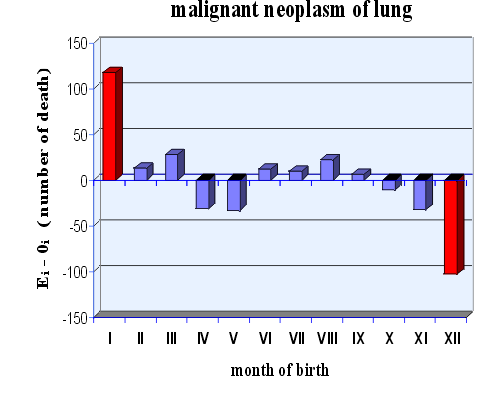
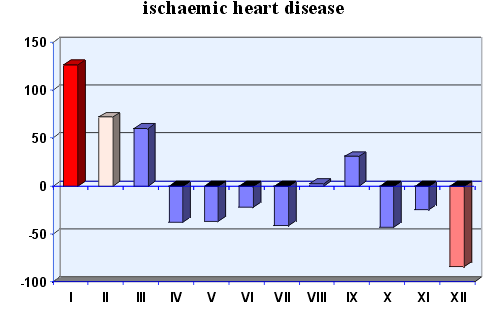
1. The persons born on December have the lowest probability of “premature” (untimely) death (the death before the age of 55 year). This rule is valid also for mortality rates by reason of cancers and ischemic heart disease. As opposite the persons born on January has the highest probability of “premature” death.
Probably this unexpected results of our computations is related, in a uncomprehensible manner, to so called winter solstice.
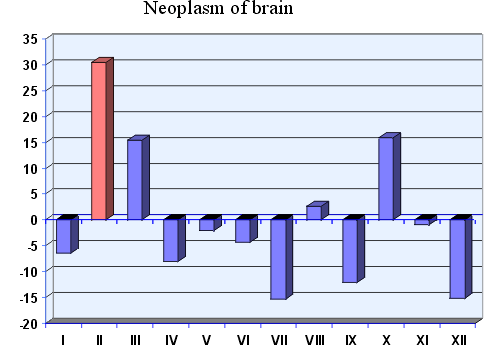
2. Adult people, but born in February (date of conception in May) die more often by reason of the tumour of the brain.
It is very probably that the solar (and other kind of radiation) reading the surface of the planet on May and June (the months crucial for organogenesis of the foetus) are very particular.
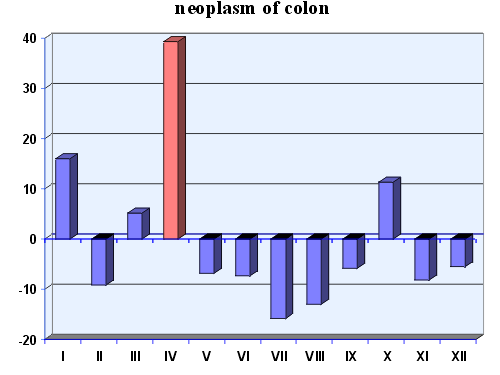
3. Adult people, but born on April die more often by reason of the cancer of the colon.
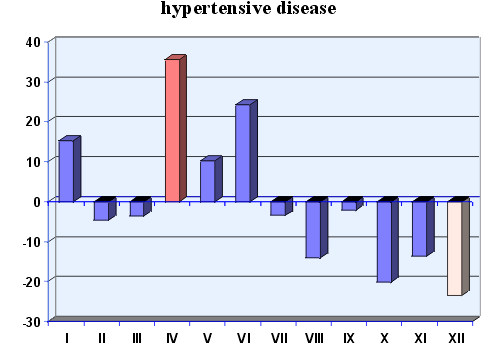
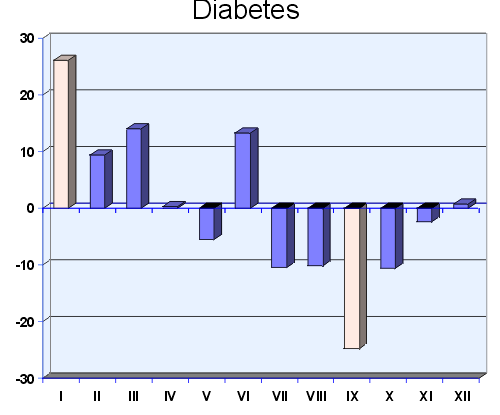
Such singularity found also for hypertension and diabetes convince for a thesis that the patterns of the radiation, reaching the surface of the planet influences differently people in borns subsequent monthes of the year.
Why the cooperation with scientists from the countries of Southern hemi-sphere is desired?
We assume, by the formulation of one of the most interesting hypothesis, which we plan to try to verify, that the pattern of light (and other radiations) perceived by a pregnant woman influences, through melatonin (and induced “cocktails” of hormones and cytokines) the development of the foetus. The different seasons (monthes) of conception predispose then to different diseases in adult age.
Of course, all singularities, presented shortly above in the sub-chapter “The initial set of hypotheses” should be opposite in the countries of Southern hemi-sphere.
The detailed motives of the project
The physicians need a better theory of the disease. They feel that diseases should be understand not only as a malfunction of the organism but rather more general, as an “evil” callsing harm an unhappiness. The demand for a better theory of medicine is very pragmatic.
The better understanding of general causes of the diseases facilitate consideration of the mechanisms of a particular diseases. The understanding of pathogenesis of a particular diseases has very practical consequences.
Till now, in general, physicians understood the disease as the malfunction of the organism.
Inappropriate function of the organism can happen when the structure of the organism is not good.
The appropriate pattern for the structure of the organism is recorded, of course, by a genetic code in the DNA molecules of chromosomes of any cell. The genetic code should keep also information about the right course of embryogenesis.
The error of the structure can happens during the development of the embryo or later in childhood or even adolescence .
Of course the disease can arise by the damage of an internal organ in the adult age .
All the history of the development of medicine consists on progress in the recognition of different factors causing the damage of the organism .It is known that medicine consider microbes and viruses on the first place, as an ethiologic factors causing the damage in advanced stages of the development.
Remembering this general outlook of the theory of the disease it is comprehensible that contemporary the theoreticians, the biologists and even physicians believe that the most important and the most frequent cause of the disease are errors in the pattern for the structure of the organism.
Pleas remark however that the right course (sequence) in the development of embryo is equally essential.
The developing foetus is protected by the maternal organism (body) against most negative environmental influences. The embryo is protected against infections, changes of temperature. Even the majority of possible toxic chemical substances are, in some sense, filtered by the maternal organism.
There are however a class of environmental factors which influence the development of the foetus. As a symbol of this class of influences we can chose seasons and light. It is a paradox!
But, the amount of light perceived by a pregnant woman change from month to month. During the winter there are not only the long lasting dark nights but also the characteristic of solar radiation are different.
The pattern of light, which will be perceived by a pregnant woman is determined by the time of conception.
It influences the foetus by pineal gland system, throughout melatonin and its other derivates.
It could be postulated that this kind of influences is natural, but anyhow there are a variety of patterns, which can promote some particular transformations of the foetus.
This possibility should be taken into account. It is known that action of the melatonin on the development of the foetus happens throughout the foetal hormones especially gonadotropins acting on the embryogenesis of its brain.
The sequence of actions:
[The pattern of light perceived by the women -> the pattern of secretion of the melatonin -> foetal hormones -> some induced characteristics of foetal organism -> some predisposition’s of the child for disease in the adult age]
- it is only an example.
In general, this class of influences can be characterized by the influence of particular “cocktail” of maternal and foetal hormones and cytokines.
The developing embryo is exposed on particular “endocrinological cocktails”.
If the presented thesis would be true it will be the important supplement for the theory of diseases and, in general, the theory of medicine. So, it is proper to try to check this thesis.
Therefore we conceived the trial of the verification of this thesis, first, by means of epidemiological and demographic data.
We entitle this project as: The Death Certificate Project
We inserted the short outline of the project above.
The main methodological assumption:
We assume that in majority of countries physicians fill printed form, a kind of the certificate of death.
At least in Poland “the form of the certificate of the death comprises:
This simple data, but in fact the most reliable “epidemiological data” enable to design the methodology of project.
Shortly, we invite to compute the mortality rates and compare them with our results, which were published and which are presented, on this web-site!
We postulate to publish results of such comparisons.
The details of proposed way of cooperation
We plan to publish jointly the results of the comparisons of our data and data computed in other countries.
ATTENTION! We reserve the right to be the co-workers of such eventual publications in medical and scientific journals. Therefore it is necessary to sent to us e-mail the final text’s of the paper, which will be submitted for the publication.
We postulate to elaborate the texts of papers conformably with requirements of serious, international journals with rather high “impact factor”, which contents is inserted to MEDLINE data base.
Authors of the initiating partner of the project
E-mail exchange and the discussion group (community)
Temporary, please send the post related to the Death Certificate Project (D.C.P.) to e-mail boxes of the signed head of the authors of the project.
Prof. Andrzej Brodziak, M. D., Ph. D., Sc. D.
Dr Damian Kaszuba, Ph. D.
e-mail:andrzejbrodziak@wp.pl
Attention! We will develop the presentation of the project.
Materials and methods.
We analyzed the death causes in polish population in the years 1994-1995. All necessary information we have obtained from the Central Statistical Office in Warsaw. The basic document of the death statistic in Poland is, like in the other countries, the death certificate. According to that certificate the death cause is the primary disease which starts the disease process, ending with death.(36). We created file, containing numeral record of all death cases in Poland in the years 1994,1995 ( in sum 757816 cases) without children below 1 year old. Every death case was described in the following numerical sequence: 199507,191302,421185,01. The meaning of every part of this sequence is showed in the table number 1.
Table 1. Description of numerical sequences obtained from the database of Central Statistical Office.
----------------------------------------------------------------------------------------------------------------------------------
......1995......../.......07,............../.....1913......../......02,.............../..42../.1..../.....................185,.........................../..01....
year of death / month of death / year of birth / month of birth / age / sex / statistical number of death cause / number of province of Poland
-----------------------------------------------------------------------------------------------------------------------------------
Statistical number (code) of death cause is consistent with International Classification of Diseases, Traumas and Death Causes which is obligatory since 1.01.1980.
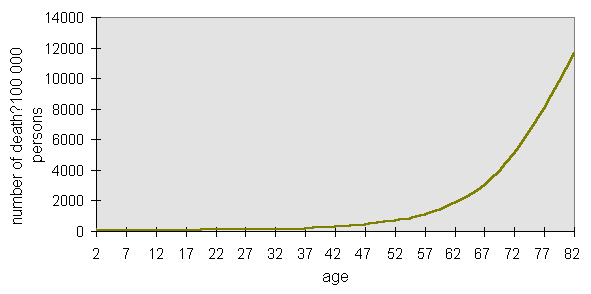
We limited our study to the group of adult person in the age between 18 and 55. This upper age border we assigned arbitrarily after the analysis of death diagram in Poland in 1993 (diagram 1).
All death cases in that population we can admit to be premature, not connected with aging.
Diagram 1. Death according to the age. Number of death falling on 100000 persons in the age between 18 and 55. Data from 1993 (47).
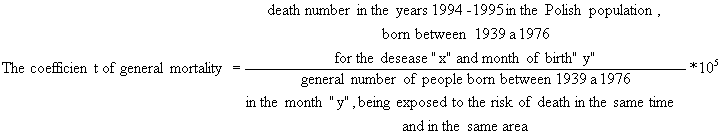
In our analysis we needed also information about “ population being exposed to risk of death”. It was required to estimate a coefficient of general mortality ( formula 1)
Formula 1. The coefficient of general mortality.

In Poland we do not have any database, containing complete information about “people being exposed to the risk of death” so we had to estimate ourselves the size of this group. To achieve this aim we used additional data from Government Information Center “Pesel”. This computer database contain numbers, called “pesel” about all people living in our country. From this resource we obtained data about people in the age between 20 and 57,living in the end of December 1996 in Poland and according to the month of birth we divided this group into 12 subgroups. (table 2).
Table2.
| Month of birth |
I |
II |
III |
IV |
V |
VI |
VII |
VIII |
IX |
X |
XI |
XII |
| Number of person (age 20-57) |
1967 363* |
1679 589 |
1890 018 |
1791 840 |
1805 630 |
1650 321 |
1677 251 |
1625 566 |
1634 544 |
1568 761 |
1487 466 |
1437 813 |
In our analysis we created the group of “people being exposed to the risk of death” by adding the number of people in the age 20-57, dead in 1995 and number of people in the age 19-56, dead in 1994 to the number of all persons in the age 20-57 staying alive in the end of 1996. We made this calculation according to the month of birth. The outcomes are showed in the table 3.
Table3.
|
Month of birth |
I |
II |
III |
IV |
V |
VI |
VII |
VIII |
IX |
X |
XI |
XII | |
|
a |
People dead in 1994 in the age 18-55 |
6526 |
5286 |
6049 |
5534 |
5599 |
5253 |
5119 |
4968 |
5099 |
4925 |
4602 |
4069 |
|
b |
People dead in 1995 in the age 19-56 |
6936 |
5600 |
6396 |
5983 |
5983 |
5752 |
5573 |
5461 |
5582 |
5115 |
4965 |
4386 |
|
c |
People dead in 1996 in the age 20-57 |
7502 |
6032 |
6876 |
6384 |
6434 |
6063 |
5972 |
5812 |
5956 |
5541 |
5316 |
4717 |
|
d* |
“people being exposed to the risk of death” |
1988 327 |
1696 507 |
1909 339 |
1809 741 |
1823 646 |
1667 389 |
1693 915 |
1641 807 |
1651 181 |
1584 342 |
1502 349 |
1450 985 |
To sum up, we analyzed mortality from various diseases of adult people according to the month of their birth.
The research was conducted in the population living in Poland in 1994 in the age between 18 and 55. It means that there were included subjects who were born in the years 1939 -1976 (20 419 528 persons). Retrospective observation of death distribution in this group included 2 following years: 1994 and 1995. The specific mortality coefficient is like the following: (formula 2)
Formula2.
We made statistical evaluation using test chi 2 and computer program Basic and Excel.
.gif)